
Bio link data is more than just clicks
Bio links have come a long way. What started as a simple workaround for Instagram’s single link limitation—essentially glorified URL shorteners—has evolved into a central hub for directing your audience. Today, a bio link isn't just a place to put links; it’s a landing page, a mini-website, and a valuable source of data about your audience. But simply knowing how many people click your bio link isn’t enough anymore.
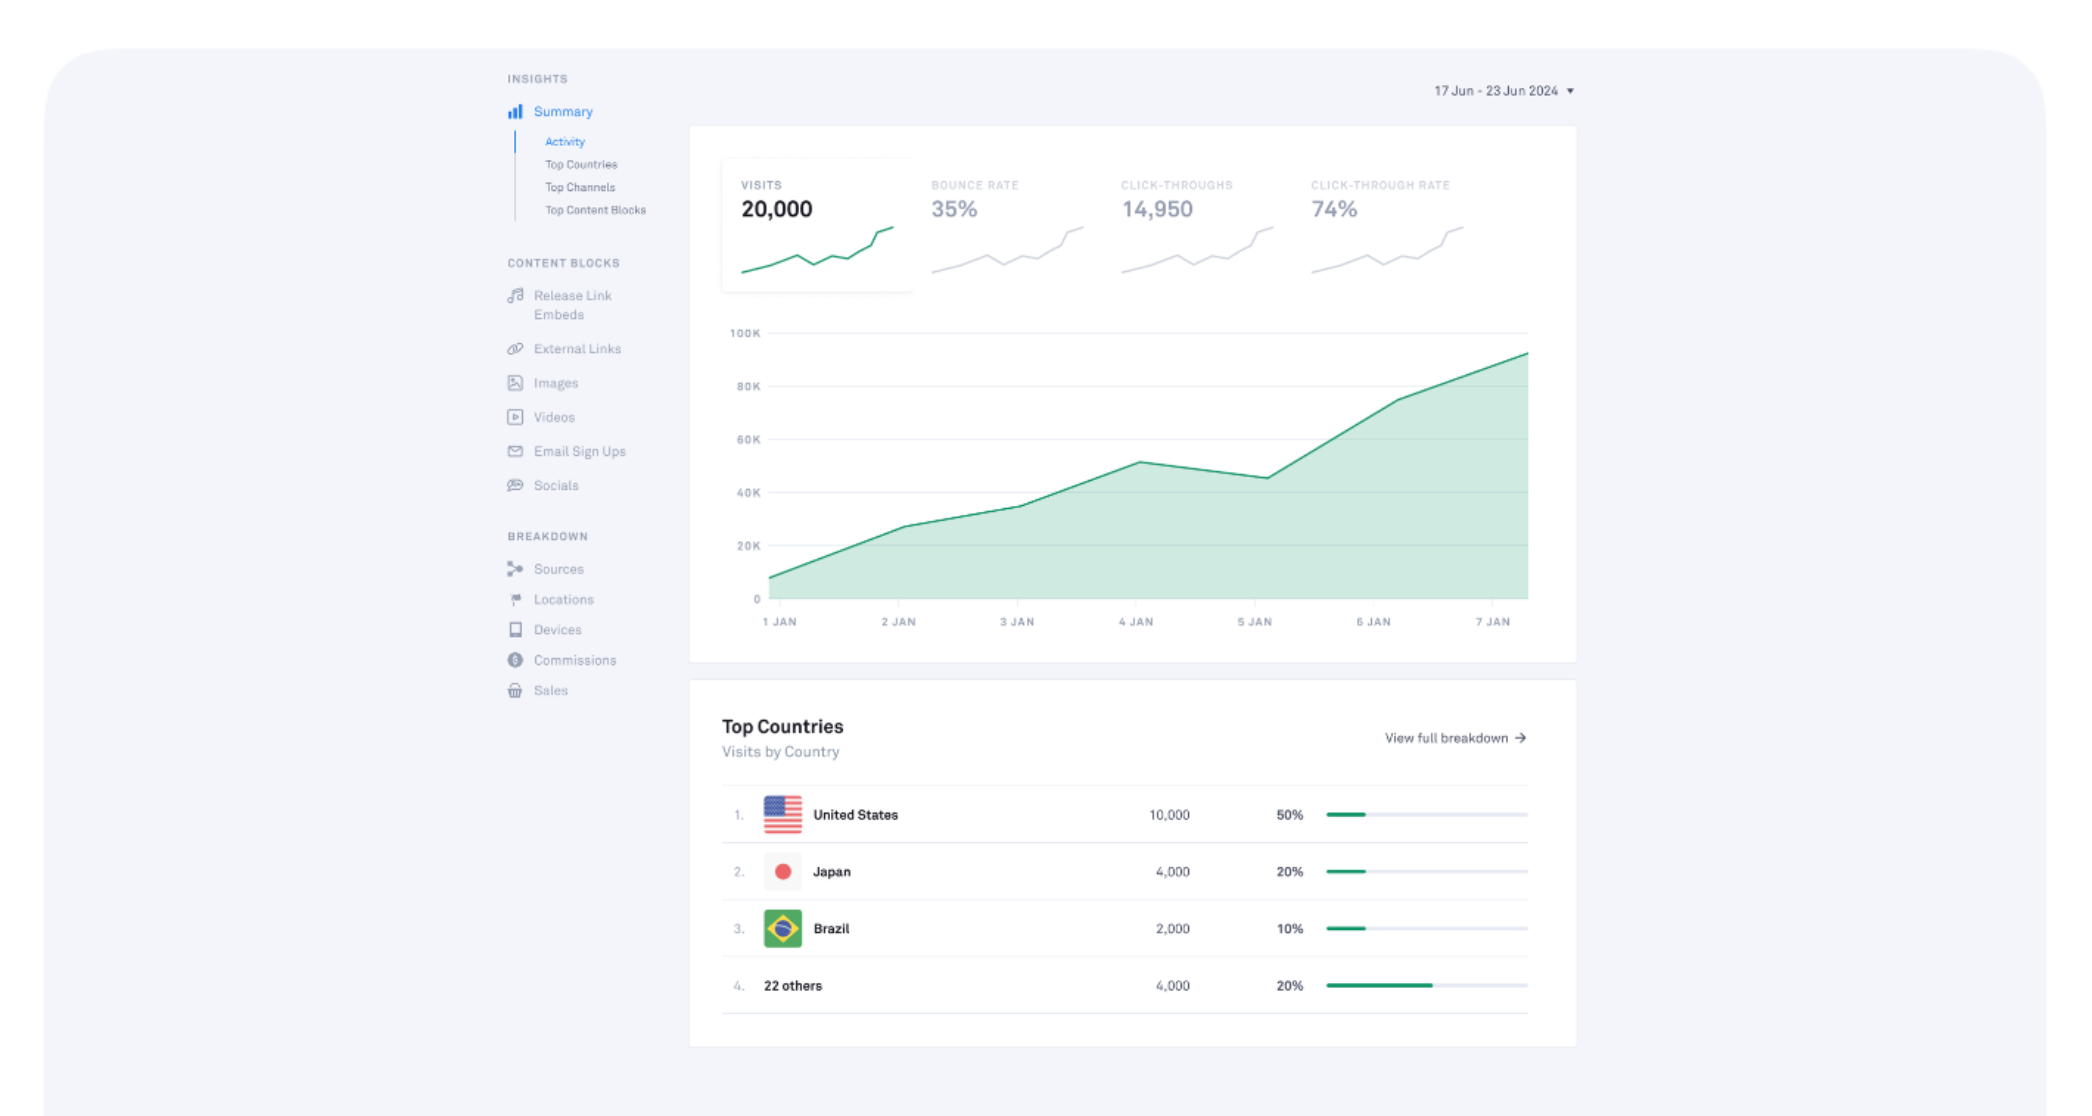
We need to understand how people are interacting with those links. Are they bouncing immediately? Are they converting? What devices are they using? This is where dedicated bio link analytics tools become essential. Platform-native analytics—Instagram Insights, TikTok Analytics, for example—offer a basic overview, but they often lack the granularity needed to truly optimize your link strategy.
I've found that relying solely on platform analytics feels like driving while looking only in the rearview mirror. You can see where you've been, but you have little sense of what's ahead. A solution like Your Custom Link provides a much more comprehensive view, allowing you to track a wider range of metrics and gain deeper insights into your audience’s behavior. It's about moving from vanity metrics to actionable intelligence.
Click-through rate
Click-Through Rate, or CTR, is the foundational metric for any bio link strategy. In this context, it’s calculated as the number of clicks on a specific link divided by the total number of views of your bio link page. It’s a simple formula, but it reveals a lot about how effectively you’re presenting your offers.
Determining a "good" CTR in 2026 is tricky, as it varies significantly by platform, industry, and even the specific audience. However, focusing on relative improvement is key. If you're consistently testing and iterating, you should see a gradual increase in your CTR over time. Factors influencing CTR include link placement on the page, the design of the buttons or links themselves, and—most importantly—the clarity of your call-to-action.
I've seen firsthand how A/B testing different button text and designs can dramatically impact CTR. Something as simple as changing "Learn More’ to ‘Shop Now’ can make a noticeable difference. Don’t be afraid to experiment and see what resonates best with your audience. It"s about continually refining your approach.
Destination URL Performance
Knowing someone clicked on a link is only half the battle. You need to understand what happened after they left your bio link. Did they make a purchase? Did they sign up for your newsletter? Did they download your ebook? Tracking conversions from each destination URL is crucial for measuring the true ROI of your bio link strategy.
This is where UTM parameters come into play. UTM (Urchin Tracking Module) parameters are tags you add to your URLs that allow Google Analytics—and other analytics platforms—to accurately attribute traffic to your bio link. Without UTM parameters, it’s difficult to isolate the performance of your bio link from other traffic sources.
Your Custom Link automatically adds these tags. While it integrates with Google Analytics to show how these clicks turn into revenue, tracking across different devices is still messy. Privacy updates mean we rarely see the full picture, but the trend data remains the best guide we have.
- Use utm_source, utm_medium, and utm_campaign to categorize your traffic in Google Analytics.
Time on site and engagement
"Time on site’ – or a similar metric for app destinations – is a valuable indicator of engagement. A quick click-through suggests little interest, while a longer duration indicates that someone is genuinely exploring your content. It"s a subtle but important signal.
Interpreting time on site data requires context. A "good" time on site will vary depending on the type of content. A blog post might warrant several minutes of reading time, while a product page might only require a few seconds for someone to decide whether to purchase. But consistently low time on site across your destination pages could indicate issues with content quality or user experience.
Remember, a slow-loading page or a poorly designed website will naturally result in a low time on site, even if the content itself is excellent. This is why it's important to consider the entire user journey, from the click on your bio link to the experience on your destination page.
Device and location data
Understanding who is clicking your links is just as important as understanding what they’re clicking on. Knowing what devices your audience uses (mobile, desktop, tablet) and their geographic location can inform your content creation and targeting strategies.
For example, if a large percentage of your traffic is coming from mobile users, you absolutely need to ensure your destination pages are fully mobile-responsive. Similarly, if you’re running geographically targeted advertising campaigns, this data can help you assess their effectiveness and refine your targeting parameters.
I’m somewhat concerned that increasing privacy regulations might limit the accuracy of location data in the coming years. However, even approximate location data can be valuable for identifying broad trends and tailoring your content accordingly. It’s something to keep an eye on.
Device & Location Data Interpretation Guide
| Device Type | High Percentage (80%+) | Moderate Percentage (50-79%) | Low Percentage (Under 50%) |
|---|---|---|---|
| Mobile | Prioritize mobile-first design and fast loading speeds. Ensure all linked content is responsive. | Review mobile user experience for potential improvements. Test on various screen sizes. | Investigate mobile usability issues. Consider a simplified mobile landing page. |
| Desktop | Ensure desktop experience is optimized for larger screens and detailed content presentation. | Maintain a consistent desktop experience. Monitor for any performance bottlenecks. | Analyze desktop user behavior. Consider A/B testing different layouts or content formats. |
| Tablet | Optimize for tablet viewing, balancing mobile and desktop elements. | Ensure content displays correctly on common tablet resolutions. | Investigate potential display issues or usability concerns on tablets. |
| United States | Focus marketing efforts and content tailored to this audience. | Maintain current engagement strategies; monitor for shifts in preferences. | Research reasons for lower engagement and consider localized content. |
| Europe | Adapt content to reflect European cultural nuances and languages. | Continue monitoring engagement; explore potential partnership opportunities. | Investigate barriers to engagement, such as language or cultural differences. |
| Asia | Prioritize localization and culturally relevant content for Asian audiences. | Monitor engagement trends and adapt strategies accordingly. | Research specific regional preferences within Asia to improve engagement. |
| Tier 1 Cities | Content resonates well with users in major metropolitan areas. | Maintain current engagement levels; explore opportunities for targeted advertising. | Investigate reasons for lower engagement in Tier 2/3 cities. |
Illustrative comparison based on the article research brief. Verify current pricing, limits, and product details in the official docs before relying on it.
Button Performance: Which Calls to Action Win?
If you’re utilizing multiple buttons on your bio link page—and you should be—you need to know which ones are performing best. Tracking clicks on individual buttons provides valuable insights into which calls to action resonate most with your audience.
A/B testing different button text, colors, and designs is essential for optimizing button performance. Experiment with different phrasing, such as "Shop Now’ versus ‘View Products’ or ‘Sign Up Today’ versus ‘Join Our Newsletter". Even subtle changes can have a significant impact.
Be blunt with your buttons. If a user has to guess where a link goes, they won't click. 'Get the PDF' beats 'Learn More' because it describes the physical result of the tap.
Retention Rate: Building a Loyal Audience
Retention rate measures the percentage of users who return to your bio link page after their initial visit. It’s a long-term metric that indicates the strength of your connection with your audience and the value you’re providing.
Tracking retention rate requires a more sophisticated analytics setup, as you need to identify returning users. Factors influencing retention rate include consistent content updates, relevant offers, and a compelling reason for people to come back. Are you regularly adding new links, promotions, or resources?
Encourage repeat visits by promoting your bio link on other platforms—in your Instagram Stories, TikTok videos, email newsletters, and so on. A high retention rate suggests that your bio link page has become a valuable resource for your audience, and that’s a powerful indicator of success.


No comments yet. Be the first to share your thoughts!